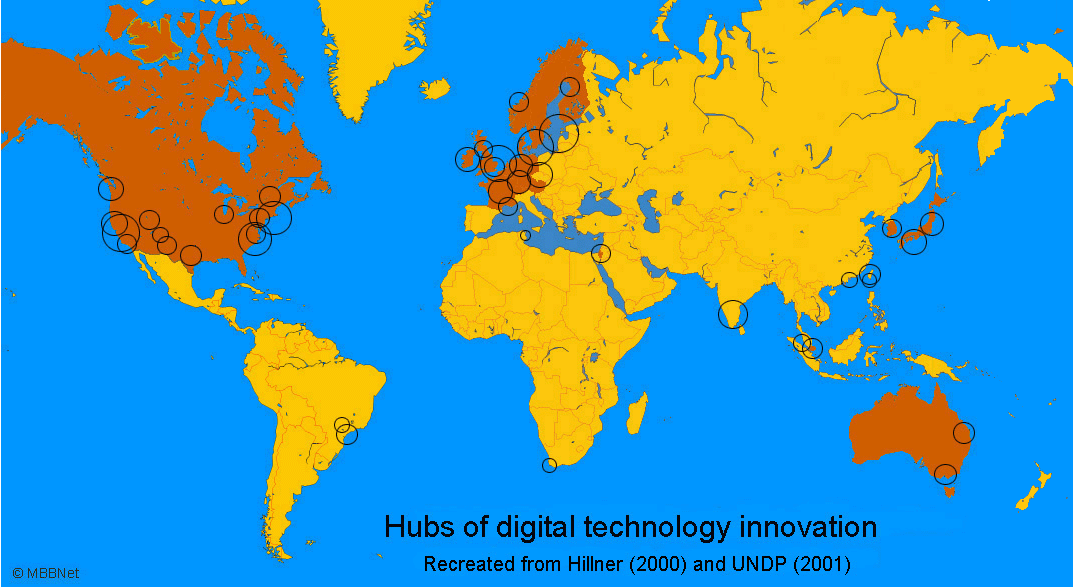

Countries colored in brown represent the leaders in digital innovation. Black circles represent digital technology hubs.
Top digital technology innovation regions by rank (Hillner, 2000):
|
Silicon Valley, US Boston, US Stockholm-Kista, Sweden Israel Raleigh-Durham-Chapel Hill, US London, UK Helsinki, Finland Austin, US San Francisco, US Taipei, Taiwan Bangalore, India New York City, US |
Albuquerque, US Montreal, Canada Seattle, US Cambridge, UK Dublin, Ireland Los Angeles, US Malmo, Sweden - Copenhagen, Denmark Bavaria, Germany Flanders, Belgium Tokyo, Japan Kyoto, Japan Hsinchu, Taiwan |
Virginia, US Thames Valley, UK Paris, France Baden-Wurtemberg, Germany Oulu, Finland Melbourne, Australia Hong Kong, China Chicago, US Queensland, Australia Sao Paulo, Brazil Salt Lake City, US |
Santa Fe, US Glasgow - Edinburgh, UK Saxony, Germany Sophia Antipolis, France Inchon, South Korea Kuala Lumpur, Malaysia Campinas, Brazil Singapore Trondheim, Norway El Ghazala, Tunisia Gauteng, South Africa |
References
Map is a Mercator projection that exaggerates the size of areas far from the equator.
Maps created with GMT software
William Hoffman - hoffm003@umn.edu